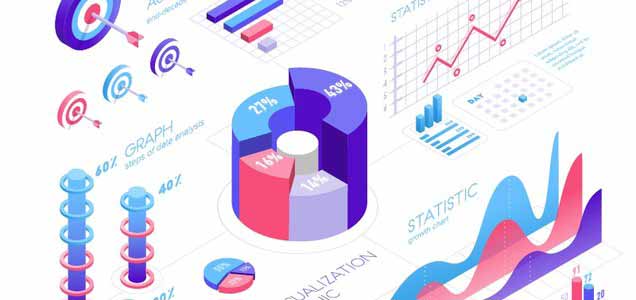
Data Visualization Techniques
Data visualization is an essential component of an excellent business strategy. Many companies are concerned with their growth, development and evolution using data-driven insights. Digital data is crucial as it provides clear and detailed insights into your business’s elements. It does all this by being in a simple, logical and digestible format.
Data visualization plays an important part in data analytics, data science in general. It helps interpret and analyze big data in a real-time period. To present that data, designers have a vast range of techniques - bars, pies, charts, maps and so on.
Data Visualization Techniques:
Knowing your audience
To actively and effectively present given data, it is important to know your audience. Make sure your content is tailored specifically for the desired audience. You have to make it both inspiring and interactive.
Some people might be happy with a simple pie chart. However, depending on the type of data you’re presenting, it is vital to implement the right technique.
Before a meeting, make sure to always do some research. Be certain that your visuals and graphics meet your clients’ needs.
Choosing the right chart type
In order to present your data correctly and successfully, you must pick the right type of chart. This depends on what kind of of project you’re presenting, the type of audience and what is your overall purpose. Here is an example:

Maps
Maps are an important part of our life. When it comes to data visualization, maps serve the same purpose as the physical ones. Within different industries, you can use maps to visualize data. On them, you can locate elements on important areas and objects. For example, geographical maps, building plans, website layouts, etc.
There are several types of maps:
● Regional Map
● Point Map
● Flow Map
● Heat Map
Charts
Charts are the most common way of presenting data. They are easy to use and they show data in an uncomplicated way. There are many types of charts you can choose from.
● Pie Chart - This type of chart is used in many areas. Pie charts effectively represent different classifications and their proportions. It also enables you to compare them and actively show results.
● Bubble Chart - It displays three dimensions of data. It is often used to present financial data. Different bubble sizes are useful to visually emphasize specific values.
● Flow Charts - This is the kind of chart that represents the set of algorithms. It gives a step-by-step insight of a process. The steps are connected with lines and arrows that show direction. This is a simple way to guide someone through the process of a workflow or a project.
Using the color theory
Once you’ve chosen the type of chart, map or any visual tool to use in your presentation, it is time for the most important element - color. Color plays a massive role in how your message and data will be delivered.
Make sure the color you’re using is consistent through your presentation. Use sharp contrasts to highlight important parts. That way people will be able to note the critical information.
Taking care of the Big Data
In the age where big data is becoming overwhelming to deal with, it is important to know how to take care of it. Data visualization is a tool that presents the big data in a simpler way. Data scientists use tools and techniques to visually and interactively represent the information. They compress it into a more human format, making it more attractive and appealing.
With data visualization there are many ways you can present and show data. By using a combination of images, graphics, figures, graphics, colors you express complex information. These visual elements are necessary as they express the relationship between humans and machines.
However, you have to remember that data visualization isn’t presenting data only. It also interprets it and understands it.